By Representative David Gomberg, House District 10
11/16/26
Dear Friends and Neighbors,
On my long drive back across the district last week, I listened to a thoughtful OPB podcast about education in Oregon.
For some time I’ve been planning an education newsletter. I’ve been collecting articles and data in an effort to explain how we spend more than many other states and get seemingly lesser results.
Oregon ranks lower than other states on reading and math proficiency. But before we blame teachers or administrators, we need to look at the larger context.
The state also has one of the shortest school years in the country. And one third of Oregon students aren’t attending school consistently. Oregon ranks 47th out of 50 in total hours of time in school during an academic year. Our kids just don’t have enough time, and our educators don’t have enough time. It’s really hard to become a strong reader when you don’t get time for lessons and time to practice.
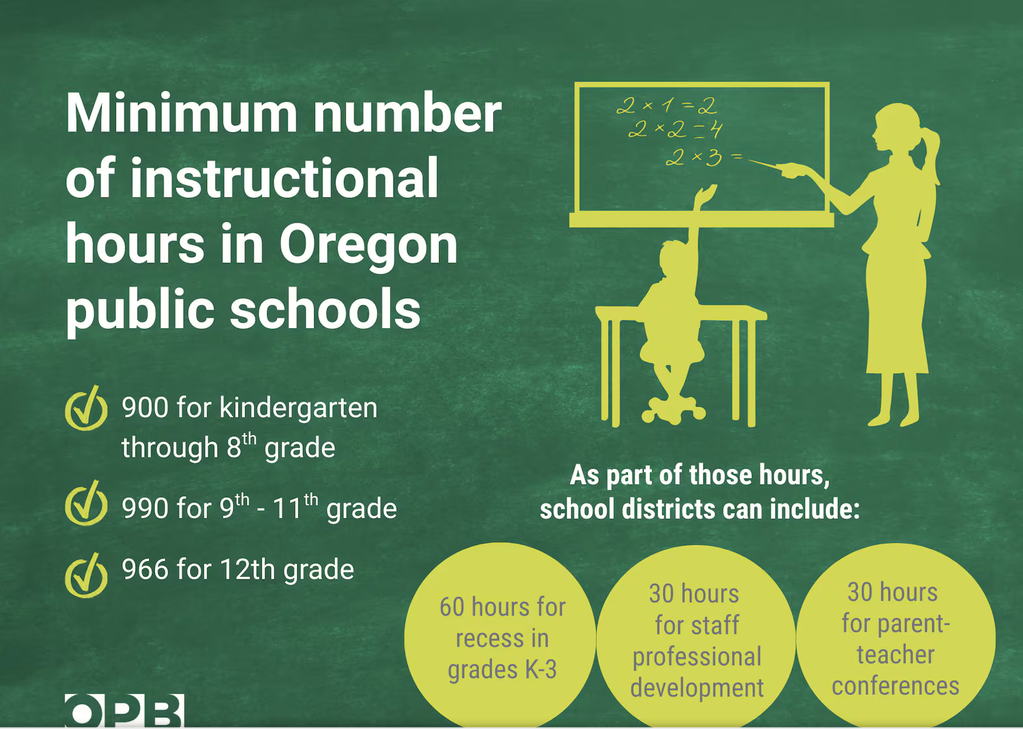
Nine hundred hours. That’s the minimum amount of instructional time Oregon requires of its elementary schools. It’s 990 hours for ninth through 11th graders, with a 966 hour requirement for seniors. (This modification allows flexibility for 12th graders who work or have other time commitments after completing their high school credits.)
At the national level, the average year across K-12 public schools is 1,231 hours.
Let me say that another way. Washington state requires a minimum of 180 days of instruction, with mandatory annual hours of 1,000 for kindergarten through 8th grade and 1,080 for grades 9-12. Over the course of 12 years, Washington State students are graduating with the equivalent of a year more classroom time than Oregon students. Is it any wonder we score lower on tests or are less prepared to work, succeed, and thrive after school?
Complicating things even further, Oregon has long allowed school districts to count up to 30 hours of parent/teacher conference time and 30 hours of professional development for teachers towards its instructional time totals, even though students are not in school during that time.
While not classroom time, this is still important time. High-quality instruction is what drives student achievement. That requires ongoing teacher professional learning. Reducing professional learning as part of a well-rounded education system will impact results.
Engaging parents is critical in improving the school-to-home partnership for academics and attendance. Not valuing protected time to connect with families will impact results. More hours will also come with an additional cost because even though teachers are already working during those 60 hours, buses, food service, and many classified staff are not.
Under new executive orders from Governor Kotek, Oregon is now requiring more instructional time. About half of Oregon school districts—approximately 292,000 students across 95 school districts and 36 charter schools—say they will have to add more hours to future school year calendars to comply with the executive order.
| Now let’s talk attendance.
More than one-third of Oregon students missed at least 17 days of school in the 2024-25 school year. The 33.5% chronic absentee rate is the second highest rate of states that have released such data so far.
Chronic absenteeism “means not attending school for 10 percent or more school days in a school year.” Just over 33% of Oregon students failed to meet the threshold. Then consider this: The Oregon Department of Education has said students should be marked “present” if they are a full-time student as long as they attended 51% of the first half of the school day or 51% of the second half of the school day.
A recent summary from the University of Oregon’s HEDCO Institute offered five possible solutions for schools struggling with students missing large amounts of the school year.
- The first, change curriculum to increase student engagement.
- The second, foster relationships and mentoring for students by either adults or other students.
- The third, increase family connections with their child’s school.
- The fourth, ensure messages to parents about absences contain deeper information beyond the fact that a child missed school.
- The fifth, use a whole school approach that involves the use of multiple means to ensure a student doesn’t slip through the cracks.
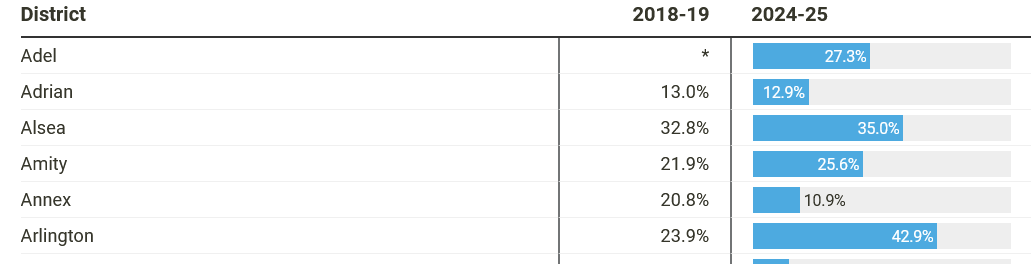
This article has a searchable data base showing absentee rates for districts across the state. It reports 30.2% in Lincoln, 35% in Alsea, 23.2% in Monroe, and 18.5% in Philomath. |
|
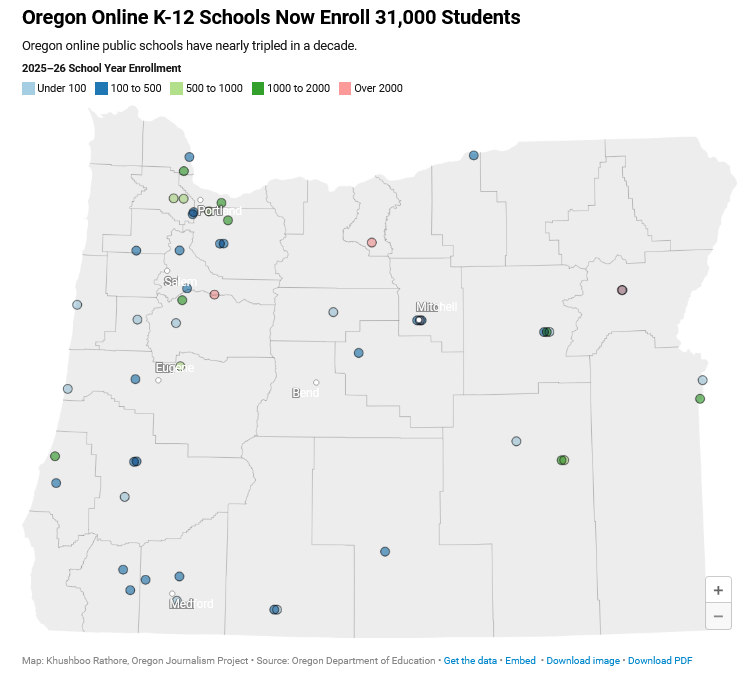
| Interest and enrollment in online schools blew up during the COVID-19 pandemic, when schools closed their doors and instruction moved online. In Oregon, students learned remotely, at home, longer than students in other states. Thousands of students stayed online.
Ten years ago, a little over 12,000 students attended school virtually, according to the Oregon Department of Education. Today, the total is more than twice that. If all of Oregon’s virtual schools were put together into one school district, it’d be the fourth largest in the state, with more than 28,000 students from all over the state.
As Oregon’s total public school enrollment has dropped by more than 37,000 students, the number of students attending virtual schools in the state has steadily increased, including a significant boom during and immediately after the COVID-19 pandemic. For years, the Oregon Secretary of State has pushed the Department of Education to increase oversight and accountability for online schools, but it hasn’t. State officials say they will soon be holding virtual schools accountable for meeting academic targets under a new Oregon law. |
|
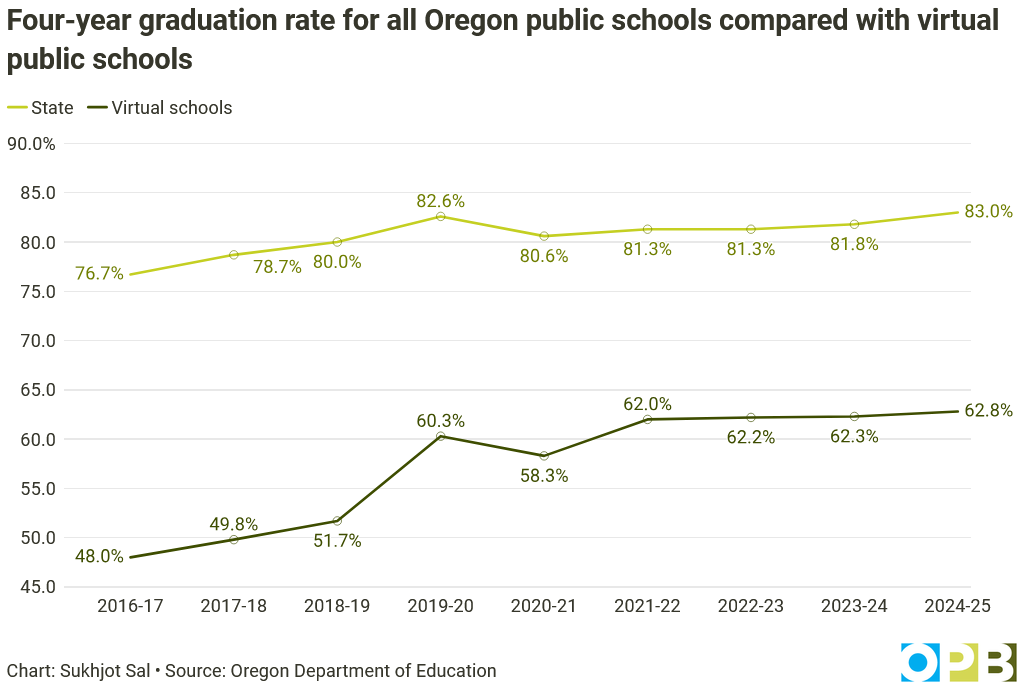
| The Oregon Department of Education’s most recent data brief on the topic showed virtual students are less likely to be on track to graduate at the end of ninth grade than the state average.
The only thing that’s typical about a virtual school in Oregon is that the majority of learning takes place online. After that, virtual schools across the state fall into a few different categories, according to Oregon Department of Education classifications. Some online schools are district-run. Others are charter schools run by a separate entity but sponsored by a school district or the state. Alternative schools offer different types of learning environments based on student needs, some of which are administered online.
A 2023 National Education Policy Center report found “virtual school performance remains poor” in the country. It recommended that state legislatures “establish a virtual school student intake screening” and require virtual school graduation rates to meet statewide averages. Oregon has not taken such steps. |
|
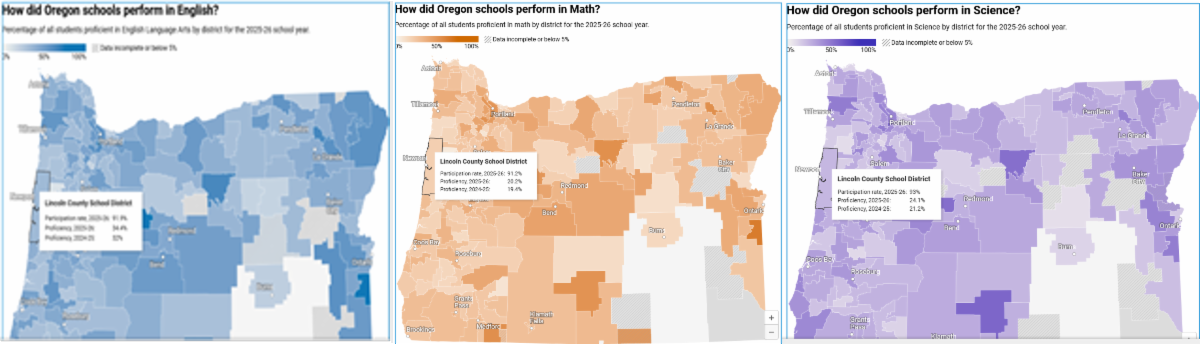
| Test results are a frequent aspect of the school conversation. Oregon’s state standardized tests measure math, science, and English Language Arts achievement for students in grades three through eight, as well as 11th grade, as a measure of “how well our education systems are supporting student learning.”
Most Oregon public school students continue to score below state proficiency standards, though recent data show slow, incremental improvements. According to data released by the Oregon Department of Education:
- English Language Arts (ELA): 43.8% of students tested met or exceeded the state standard (a 0.8 percentage point increase over the previous year).
- Mathematics: 32.9% met or exceeded the standard (a 1.4 percentage point increase).
- Science: 30.6% met or exceeded the standard (a 0.6 percentage point increase).
Independent analyses (such as the National Assessment of Educational Progress, or NAEP) continue to rank Oregon near the bottom of states when adjusted for student demographics and poverty. |
|
| The results are not good. But let’s take a breath and look beyond the numbers.
Vast numbers of 11th graders opt out of taking the Oregon Statewide Assessment System tests, known as OSAS, which measure their mastery of math, science, and English.
Among the 10 largest districts in the state, high school participation ranges from just shy of 90% in Salem-Keizer for math and English to a dismal 33% for the math test in Eugene. In Portland Public Schools, about 72% of last year’s 11th graders took the English test, and 66% were tested in math.
Low participation rates—which come courtesy of Oregon’s generous opt-out laws, which require school districts to notify parents that they may excuse their children from state testing —make testing data from high schools too low to support accurate comparisons between schools and over time. That leaves decisionmakers at least somewhat in the dark about how prepared high school students really are for college or the job market and where to target resources to help those who are struggling.
Bottom line—tests are not a good measure, but we’re still not doing well.
Oregon schools receive funding through a combination of state, local, and federal sources that work together to support our children’s education.
- State Sources (~52%): The largest share comes from the state—primarily through the State School Fund (SSF), which is backed by state personal and corporate income taxes and Oregon Lottery receipts.
- Local Sources (~38%): Local funding comes mainly from local property taxes, along with minor local fees, earnings on investments, and district activities. Historically, after voter-approved property tax caps like Measure 5 and Measure 50 in the 1990s, Oregon shifted away from heavy reliance on local property taxes toward state-collected income taxes.
- Federal Sources (~10%): Federal funds help support specialized programs, such as Title I, special education services, and school nutrition programs
We use a complex equalization formula to distribute the State School Fund and local operating revenues to the state’s 197 school districts and 19 education service districts. The formula considers how many students are enrolled, extra “weights” to certain student populations like special education, English language learners, or poverty. Because districts raise different amounts of local property tax depending on their local tax base, the state formula adjusts state aid so that districts with lower local property wealth receive a larger share of state dollars
Currently, 14.8 percent of all Oregon students qualify for special education services. The school funding formula caps district compensation at 11 percent of overall enrollment. The results are that special education programs are broadly underfunded and understaffed.
Oregon’s new graduation rates for the Class of 2025 show continued improvement in getting a higher percentage of students to complete high school. But Oregon’s graduation rates are still lower than those in many states. And Oregon trails other states in most of its academic outcomes, despite being middle of the pack in spending. |
|
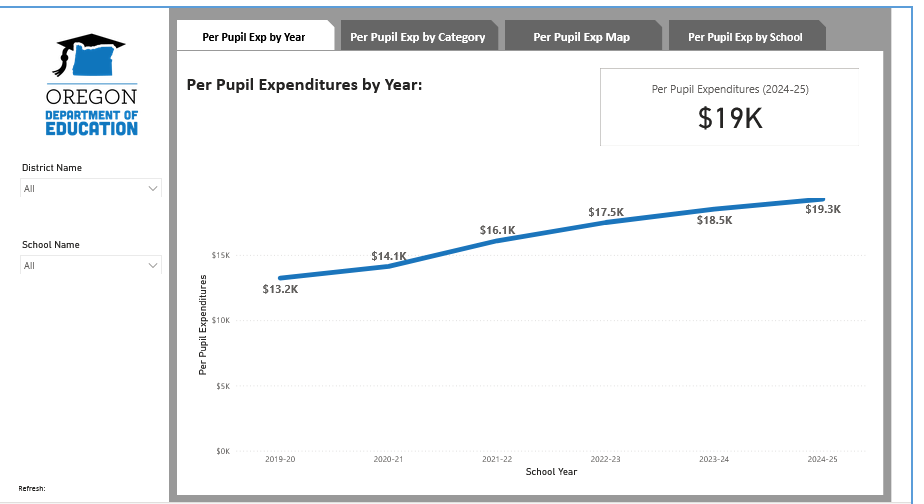
| I have been pleased to support the largest state spending for education in Oregon history. The Oregon Legislature approved a record $11.3 billion in state school funding for the 2025–27 biennium. Oregon public school funding is approximately $22,100 per student, slightly above the national average, though districts across the state face severe budget shortfalls due to rising pension and operational costs.
One final observation about the education environment.
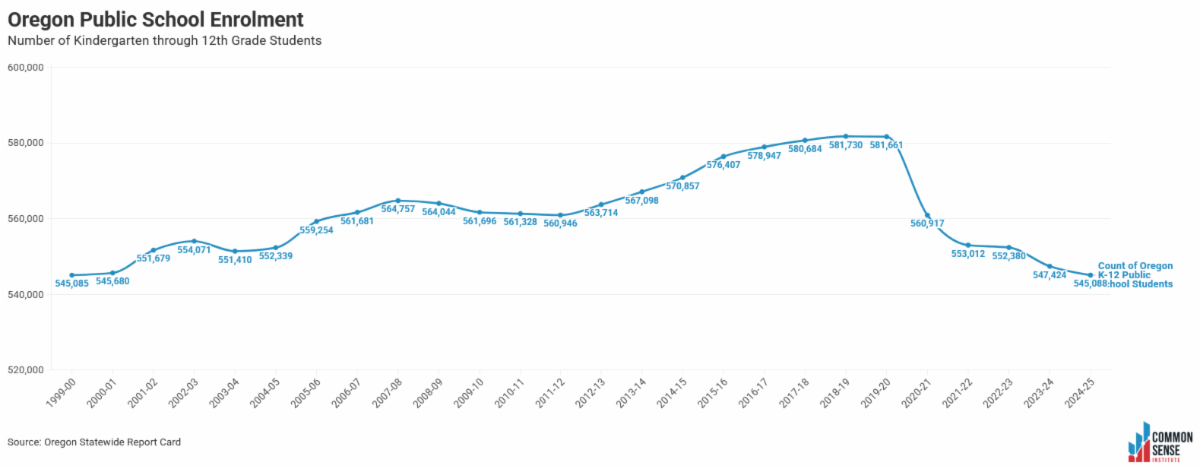
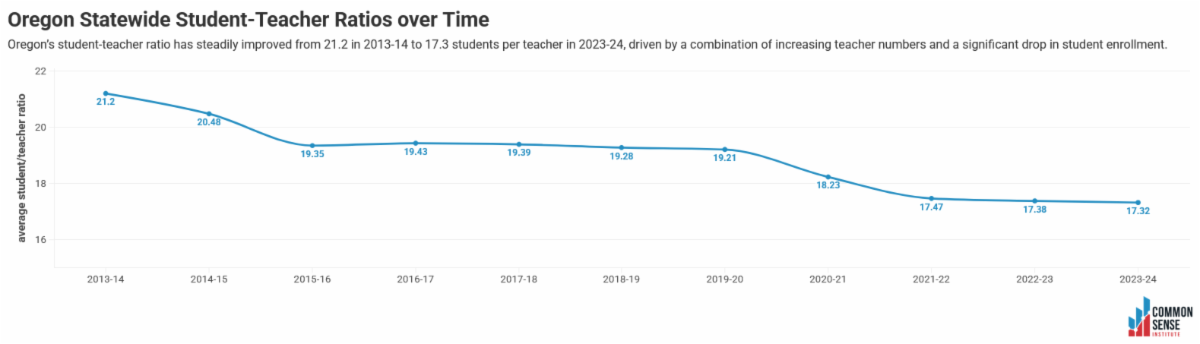
Oregon public schools are facing a statewide enrollment decline, with student numbers dropping by more than 9,000 in the 2025–26 school year alone—the largest single-year drop since the start of the COVID-19 pandemic. Oregon public school enrollment has declined by about 6.5% overall since 2015.
- Falling Birth Rates: Lower birth rates across the U.S. and Oregon have sharply reduced kindergarten and early elementary cohorts.
- Alternative Schooling: Increased shifts toward homeschooling, private schools, and online/virtual charter schools have reduced public school populations.
- Cost of Living and Migration: High housing costs and a post-pandemic slowdown in migration have led families to have fewer children or relocate out of major urban centers.
Because Oregon funds public schools largely on a per-pupil basis, lower enrollment directly translates to reduced state revenues. Many districts face multi-million dollar budget gaps for the 2026–27 school year (e.g., Eugene 4J facing a deficit near $50 million, Springfield over $8.8 million, Corvallis $4.4 million, and Bethel $1.8 million). Districts are forced to enact deep staff layoffs, program cuts, and school facility closures (such as Salem-Keizer weighing closures for up to eight elementary schools.) |
|
| So let’s summarize:
The state has one of the shortest school years in the country. Chronic absenteeism. Special needs. Declining enrollment. Disappointing but unreliable test scores. And an antiquated funding system.
It’s complicated.
Adding school days, reducing absenteeism, and supporting special student populations will cost money—money we don’t presently have. Closing schools is difficult as they support and often define neighborhoods and communities.
Fewer students doesn’t always translate into fewer classes or teachers. Whether there are 15 or 25 fourth graders in the classroom, you still need a fourth grade teacher. And we could improve test scores by making more students take tests and spending more class time preparing specifically for tests as some states do. But that means spending less time on real learning.
Like I said, it’s complicated.
I hope and expect these matters will be front and center when the legislature convenes in January. |
|