Menu
  • Home
  • Breaking News
  • Feature
    • Arts
    • Astrology
    • Business
    • Community
    • Employment
    • Event Stories
    • From the Pioneer
    • Government
    • Letters to the Editor
    • Non Profit News
    • Obituary
    • Public Safety
    • Podcast Interview Articles
    • Pioneer Pulse Podcast: Politics, Palette, and Planet – the Playlist
  • Weather
  • Guest Column
    • Perspectives
    • Don Backman Photos
    • Ardent Gourmet
    • Kitchen Maven
    • I’ve been thinking
    • Jim Heffernan
    • The Littoral Life
    • Neal Lemery
    • View From Here
    • Virginia Carrell Prowell
    • Words of Wisdom
  • Things to do
    • Calendar
    • Tillamook County Parks
    • Tillamook County Hikes
    • Whale Watching
    • Tillamook County Library
    • SOS Community Calendar
  • About
    • Contribute
    • Advertise
    • Subscribe
    • Opt-out preferences
  • Post Submission Test
  • Search...
Menu

I’ve been thinking … Gaslighting

Posted on January 21, 2025 by Editor

By Jim Heffernan
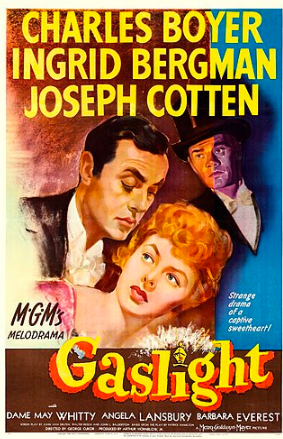
I’ve watched this 1944 movie, but it’s been a long time ago. The title has become part of our language. In Psychology, it refers to a tactic of power and control whereby abusive persons use lies and distortion to confuse and manipulate others. It happens in politics but is usually covered up by terms like “spin”, “messaging”, or “framing”.
Gaslighting boils down to being lied to, sometimes mildly, sometimes blatantly. Either way, I don’t like it.
I intend for this to be a regular column and to call out “gaslighting” whenever and wherever I see it.

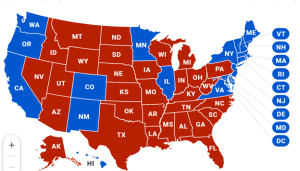
This is the map we always saw to report the results of the 2024 Presidential election. It’s accurate on a winner-take-all basis but it gaslights us about the results. Oregon in not all blue and Kansas is not all red.
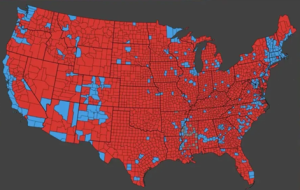
Here’s a better map. It breaks it down to counties, but it favors area over population.


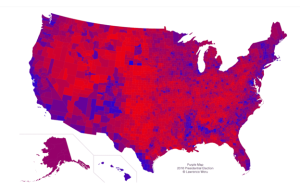
Here’s another map that merges colors and makes purples. It comes closer to the truth. Not every place was as red or blue as the county breakdown.

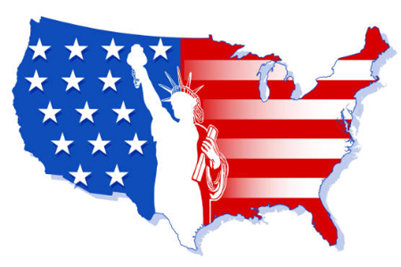
Below is my favorite map. It really doesn’t show states or counties, but I think graphically it reveals the essential truth of the election results. I like the addition of the Statue of Liberty and the implied wish for justice and equality for the whole nation. It ignores location and just represents the near 50/50 split in the election. (49.9% Trump, 48.4% Harris, 1% other).


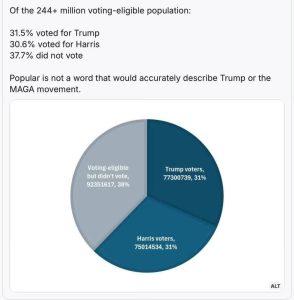
Those aren’t good numbers either. Better numbers are 32% for Trump, 31% for Harris, and, disgracefully, 38% did not vote.
It saddened me to find out in the Presidential elections between 2024 and 1976, only once did a candidate get more votes than the “did not vote” people. That was in 2020 when Biden got 34.4% of the vote and “did not vote” got 34.3%.

I’m not sure what I’ll write about next, but I suspect I’ll have plenty of material to choose from.
As always, discussion welcome at codger817@gmail.com

Featured Video

Slide Contribute SUBSCRIBE

Tillamook Weather

Tides

Tillamook County Pioneer Podcast Series

Tillamook Church Search

Cloverdale Baptist Church
Nestucca Valley Presbyterian
Tillamook Ecumenical Service

Archives

  • Home
  • EULA Privacy Policy
  • Contact
  • Opt-out preferences
  • Search...
Share on facebook
Facebook
Share on pinterest
Pinterest
Share on twitter
Twitter
Share on linkedin
Linkedin
Catherine

Recent Posts

  • David's Chair Now Available at Rockaway Beach - Official Dedication, Blessing May 17th

    May 21, 2025
  • GORDON'S VOLCANO UPDATE 5/21/25: Volcano to Erupt West of Astoria THIS YEAR!

    May 21, 2025
  • A PERSONAL POINT OF PRIVILEGE: Hurry Up and Wait

    May 21, 2025
©2025 | Theme by SuperbThemes

Manage Cookie Consent
To provide the best experiences, we use technologies like cookies to store and/or access device information. Consenting to these technologies will allow us to process data such as browsing behavior or unique IDs on this site. Not consenting or withdrawing consent, may adversely affect certain features and functions.
Functional Always active
The technical storage or access is strictly necessary for the legitimate purpose of enabling the use of a specific service explicitly requested by the subscriber or user, or for the sole purpose of carrying out the transmission of a communication over an electronic communications network.
Preferences
The technical storage or access is necessary for the legitimate purpose of storing preferences that are not requested by the subscriber or user.
Statistics
The technical storage or access that is used exclusively for statistical purposes. The technical storage or access that is used exclusively for anonymous statistical purposes. Without a subpoena, voluntary compliance on the part of your Internet Service Provider, or additional records from a third party, information stored or retrieved for this purpose alone cannot usually be used to identify you.
Marketing
The technical storage or access is required to create user profiles to send advertising, or to track the user on a website or across several websites for similar marketing purposes.
Manage options Manage services Manage {vendor_count} vendors Read more about these purposes
View preferences
{title} {title} {title}