Menu
  • Home
  • Feature
    • Breaking News
    • Arts
    • Astrology
    • Business
    • Community
    • Employment
    • Event Stories
    • From the Pioneer
    • Government
    • Letters to the Editor
    • Non Profit News
    • Obituary
    • Public Safety
    • Podcast Interview Articles
    • Pioneer Pulse Podcast: Politics, Palette, and Planet – the Playlist
  • Guest Column
    • Perspectives
    • Don Backman Photos
    • Ardent Gourmet
    • Kitchen Maven
    • I’ve been thinking
    • Jim Heffernan
    • The Littoral Life
    • Neal Lemery
    • View From Here
    • Virginia Carrell Prowell
    • Words of Wisdom
  • Weather
  • Post Submission
  • Things to do
    • Calendar
    • Tillamook County Parks
    • Tillamook County Hikes
    • Whale Watching
    • Tillamook County Library
    • SOS Community Calendar
  • About
    • Contribute
    • Advertise
    • Subscribe
    • Opt-out preferences
  • Search...
Menu
news-from-representative-david-gomberg

NEWS UPDATE FROM STATE REPRESENTATIVE DAVID GOMBERG: HD 10 By the Numbers

Posted on October 18, 2022October 18, 2022 by Editor

By Representative David Gomberg, House District 10

My report this week will contain a lot of numbers.
I’ve just finished reading the 2022 edition of Oregon by the Numbers. As Oregonians face new problems to solve, decision-makers and nonprofit organizations across our state need high-quality data and new kinds of data. Oregon by the Numbers is produced by the OSU Extension Service and the Ford Family Foundation highlighting information for each of our 36 counties across a range of topics and issues. The 2022 report is designed to support community priorities, decisions, and actions.

I have excerpted some details important for our part of Oregon. House District 10 currently includes the southern half of Tillamook County but with the New Year will lose Tillamook and add Benton County west of Corvallis. Small portions of Polk and Yamhill Counties now in the district are not statistically valid for the purposes of this discussion. And while Benton numbers may skew toward Corvallis, the comparisons are still illuminating.

Again, focusing on the counties in our district and comparing them to each other and also to Oregon’s largest county, we see some significant variations in the strength of our communities, education, the economy, health care, and infrastructure. For purposes of this update, I have omitted Lane County even though a portion of Western Lane will be in our new district. Lane numbers will necessarily be skewed toward large population centers so comparisons will not be helpful.
I often speak to the fact that median income is increasing in the urban core of Multnomah/Washington/Clackamas Counties while falling in rural Oregon and particularly along the Coast.


Median household income is the value at which 50% of households in the county earn less and 50% earn more.

Median household income in this report provides a measure of the typical or “middle” income level in a county as well as the overall economic well-being of residents. One drawback is that this measure treats all households equally regardless of the number of people in the household. The size of the household has an impact on how income is distributed to individuals. However, median household income is useful in tracking income growth, which is associated with the ability of residents to meet their needs and compare economic conditions across counties.

What this graphic starkly illustrates is the wealth disparity between urban, rural, and border counties. It does not speak to living costs in different parts of the state. And it does not speak to differences within counties. In Lincoln, there is a wide distinction between median income in Newport and Lincoln City despite the fact they are now roughly the same in population. The former enjoys jobs in fishing, research, education, and government. The latter relies primarily on tourism and retirement. A different example would be Benton County where Monroe or Alsea would be much different from Corvallis.
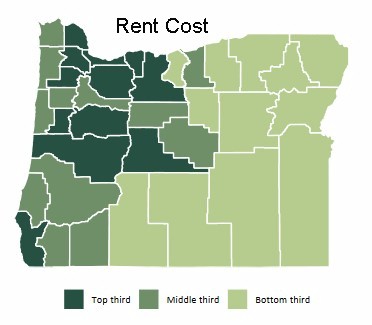
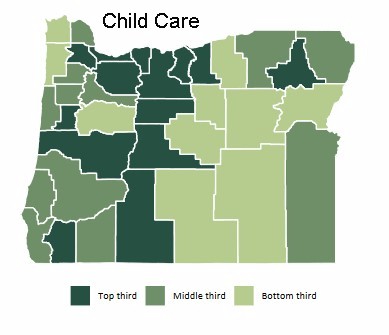
As we struggle to find workers and increase prosperity in rural and coastal communities, two issues consistently rise to the top of the list – housing and childcare.

Fair Market Rent (FMR) prices for a one-bedroom apartment are developed each year for counties and metropolitan areas by the U.S. Department of Housing and Urban Development. The figures are calculated using the rent prices paid by people who have recently moved and serve as the basis for federal housing assistance programs. FMRs can be used to look at changes in rent costs in an area over time or to compare the cost of rental housing across communities.

While rent prices vary considerably across counties, the FMR is still important to consider because of its role in determining the amount of housing assistance available to low-income and other vulnerable populations.


We can also measure the number of childcare slots available per 100 children under 13 years of age.

All 36 Oregon counties are considered childcare deserts, which means for every regulated childcare slot, there are at least three children who might fill it. As a result, many families across Oregon cannot find care for their children. The data reported here reflect childcare slots found in childcare centers or family childcare homes. Inadequate access to such care prevents parents from participating in the workforce and young children from receiving the benefits of early education often provided in those centers.


Not every child needs access to formal childcare. Some parents can rely on relatives or neighbors to care for their children. Couples sometimes work different shifts with no overlapping hours so that they can avoid the need for childcare. Still, there is a tremendous shortage of supply — a challenge made significantly worse by the COVID-19 pandemic.

What I see in these maps is that generally, our housing and childcare costs are neither the best nor the worst in the state. We’re in the middle third. But that is no consolation to people looking for housing or care for their children.


Our ongoing Unemployment Rate is a different matter. Despite the plethora of help wanted signs everywhere, our unemployment continues to rate higher than most parts of Oregon

The Unemployment Rate is the percentage of the population who do not have a job, are currently available for work, and are actively seeking work.

Unemployment has an impact on the individuals who are without work, their families, and their communities. The purchasing power of those workers is lost, as are the goods and services they might have produced. People who are unemployed are also at a higher risk of social challenges. The unemployment rate serves as both a measure of labor availability and an overall indicator of a county’s economic health.

While Oregon by the Numbers covers in detail a number of subjects that range from education to health care to even the average number of miles residents drive, I wanted to highlight here two topics I hear about the most when visiting neighborhood doorsteps – property taxes and crime.

Property taxes per person is calculated as the total property tax imposed divided by the number of people in the county.

Property tax serves as an important source of revenue for local governments. Per capita property tax is an indicator of the capacity of local government to provide services such as public safety, roads, and other infrastructure, parks and recreation, as well as public health. It is also a measure of the relative tax burden.

The report also details the annual number of crime offenses per 1,000 residents in a county. The “Crime Index” tracks willful murder, forcible rape, robbery, aggravated assault, burglary, theft, and arson.

Crime rates reflect the relative safety of an area, but crime also has important social and economic influences on communities. High rates of crime are associated with population mobility, weaker attachment of residents to their community, less local involvement, and lower home values.


The Crime Index is created to provide a standard measure of particularly important crimes against people and property across the United States. Tracking crime helps prioritize law enforcement operations, public safety budgeting, and local community development efforts.


Significantly for our district, the Crime Index does not consider how visitors to areas like the Coast influence overall rates since it is based only on permanent year-round residents.

Finally, I wanted to touch on education. The report details the number of students kindergarten ready, progress at the third grade, and again at ninth grade. I decided to jump to the end and consider overall graduation rates and the percentage of students who earned a standard high school diploma within five years of starting high school.

The high school graduation rate indicates a community’s well-being as well as the skill of its workforce. Over the last few decades, the gap in wages between those with a high school diploma and those without one has provided a strong incentive for students to complete high school.

Still, across Oregon, a significant group of students require more time to graduate. The reasons are many — from family struggles to academic issues. Those students need adequate support to complete their secondary education in a timely fashion. Students who do not achieve this benchmark will likely face significant challenges attaining adult milestones such as gaining employment or continuing their education.


Tracking the five-year high school graduation rate provides communities with a clearer measure of high school completion. It also encourages policies and practices that will support students who need more time to finish their high school requirements.

Here is a table that shows county rankings in each of the categories I reviewed.
Oregon by the Numbers serves as a snapshot of the state and its counties at a particular moment in time.

We can use the results to influence programs and policies that affect the lives of Oregon’s children, families, and communities. We can better assess our strengths, weaknesses, needs, and assets. Certain data confirm that we have our challenges. I will take that message to Salem as I have in the past to advocate for investments in our part of Oregon and not just where the most people reside.

But there is something that numbers do not reflect. And that is our quality of life, our quality of habitat and environment, and the richness of our communities. We live here by choice and every year, millions visit here to temporarily embrace what we relish all year round. That means something.

So let’s strive to address our weaknesses together and support our leaders as they pursue results. And let’s remember all the things we really enjoy about where we live.

To see the full report, visit this link.

Friday was a busy day. I attended the change of command at NOAA and then the Newport Chamber luncheon. I drove back to Lincoln City for the ribbon cutting at the Pelican Brewpub, returned to Newport for the opening of the Michael Gibbons and Rich Bergeman exhibitions at Pacific Marine Heritage Center, and finished the day with friends who purchased a social hour with their Representative to benefit the Siletz Bay Music Festival.
Sunday, an exuberant group of volunteers fanned out across Philomath to visit residents, share campaign information, and hear their concerns.
Monday I will be meeting with the Secretary of State to discuss possible changes in election law, and also completing an interview with Yachats News. Tuesday I meet with Senator Merkley’s new field staff. The Environmental Forum scheduled for Tuesday night has been canceled.

Thursday I’ll be in Newport speaking at the Lincoln County Economic Summit and that evening, participating in a forum hosted by the League of Women Voters at the College Campus. Friday there is a ribbon cutting at the Community Center in Lincoln City. And then Saturday I’ll help dedicate the “Sea Star Sculpture” at the Lincoln City Cultural Center before heading for Corvallis to watch the beavers trounce Colorado.

I’ll close this week with a public service announcement.

Your election ballot should arrive in the mail this week. The larger campaigns keep track of who has returned them. They don’t know how you voted, but they know whether you have voted. And after a few days, they focus campaign visits, phone calls, and texts on people who still have ballots in hand.

To stop the calls, vote early!

Thanks for your interest and for being part of keeping Oregon informed and engaged.


Slide Slide Slide Slide Slide Slide Slide Slide Subscribe Contribute

Ads

Featured Video

Tillamook Weather

Tides

Tillamook County Pioneer Podcast Series

Tillamook Church Search

Cloverdale Baptist Church
Nestucca Valley Presbyterian
Tillamook Ecumenical Service

Archives

  • Home
  • EULA Privacy Policy
  • Contact
  • Opt-out preferences
  • Search...
Share on facebook
Facebook
Share on pinterest
Pinterest
Share on twitter
Twitter
Share on linkedin
Linkedin
Catherine

Recent Posts

  • SEASIDE AQUARIUM REPORTS HUGE SUNFISH WASHED ASHORE SOUTH OF SUNSET BEACH TODAY JUNE 28th

    June 28, 2025
  • Karen Reddick Yurka Named Manzanita Citizen of the Year

    June 28, 2025
  • OREGON DEPT. OF TRANSPORTATION (ODOT): Tillamook County Transportation System Plan SURVEY Closes June 30th

    June 28, 2025
©2025 | Theme by SuperbThemes

Manage Cookie Consent
To provide the best experiences, we use technologies like cookies to store and/or access device information. Consenting to these technologies will allow us to process data such as browsing behavior or unique IDs on this site. Not consenting or withdrawing consent, may adversely affect certain features and functions.
Functional Always active
The technical storage or access is strictly necessary for the legitimate purpose of enabling the use of a specific service explicitly requested by the subscriber or user, or for the sole purpose of carrying out the transmission of a communication over an electronic communications network.
Preferences
The technical storage or access is necessary for the legitimate purpose of storing preferences that are not requested by the subscriber or user.
Statistics
The technical storage or access that is used exclusively for statistical purposes. The technical storage or access that is used exclusively for anonymous statistical purposes. Without a subpoena, voluntary compliance on the part of your Internet Service Provider, or additional records from a third party, information stored or retrieved for this purpose alone cannot usually be used to identify you.
Marketing
The technical storage or access is required to create user profiles to send advertising, or to track the user on a website or across several websites for similar marketing purposes.
Manage options Manage services Manage {vendor_count} vendors Read more about these purposes
View preferences
{title} {title} {title}