Menu
  • Home
  • Breaking News
  • Feature
    • Arts
    • Astrology
    • Business
    • Community
    • Employment
    • Event Stories
    • From the Pioneer
    • Government
    • Letters to the Editor
    • Non Profit News
    • Obituary
    • Public Safety
    • Podcast Interview Articles
    • Pioneer Pulse Podcast: Politics, Palette, and Planet – the Playlist
  • Weather
  • Guest Column
    • Perspectives
    • Don Backman Photos
    • Ardent Gourmet
    • Kitchen Maven
    • I’ve been thinking
    • Jim Heffernan
    • The Littoral Life
    • Neal Lemery
    • View From Here
    • Virginia Carrell Prowell
    • Words of Wisdom
  • Things to do
    • Calendar
    • Tillamook County Parks
    • Tillamook County Hikes
    • Whale Watching
    • Tillamook County Library
    • SOS Community Calendar
  • About
    • Contribute
    • Advertise
    • Subscribe
    • Opt-out preferences
  • Post Submission Test
  • Search...
Menu
Researchers drill core samples from the sea ice near McMurdo Station in McMurdo Sound, Antarctica. To examine the composition of Earth's atmosphere in the past, the ice itself is melted and analyzed by mass spectrometry to obtain oxygen and hydrogen isotopes, whose ratios help with understanding some of the details of past climates.

Tracking the Changes – Climate Science made Simple

Posted on June 11, 2024 by Cara Mico, Assistant Editor

We’re back with another article in our series on climate change! It’s been a hot minute (har-dee-har-har) so let’s take a moment to recap what’s happened since our last missive.

  • Plastic continues to be a major concern, in fact it’s in testicles now
  • But hey! The good news is that the western drought was somewhat abated by an exceptionally wet El Nina year

After spending an inordinate amount of time online I discovered a crucial fact that is inspiring today’s article.

Most people aren’t research biologists! I know, shocking right?! While I only had a handful of years as a professional research biologist I feel that it’s my journalistic duty to bring y’all up to speed with the data. I’m not talking data dump, I’m talking let’s teach you about the metrics researchers use to track climate sciences.

Here are a few of the key indicators that many researchers use to investigate the human impact on our changing climate:

  • Peak annual air temperatures
  • Ocean temperatures
  • Ocean pH
  • Atmospheric carbon
  • Atmospheric methane
  • Rainfall averages (timing and location)
  • Flower bloom
  • Insect hatch (timing and composition)
  • Long-term solar cycles

While there are countless other metrics researchers use to better understand the human influence on the planet’s ecosystem, these are the easiest to understand. They are also the most widely understood and tracked so give us the clearest picture of what is happening.

This summer, we’re going to break down the science behind each metric and we’ll provide you with enough detail for you to understand where and how this data is collected, by whom, and how it informs larger climate models.

This is a learning process for all of us! I’m not a climate researcher, my own background was in habitat restoration ecology (what people needed to do to a specific ecosystem to improve conditions for specific species, mostly salmon) and water quality (how land management actions impacted stream health). I don’t hold a PhD so many might consider my paltry undergraduate degree in the subject hardly expertise, but I did work for many land management agencies throughout the state of Oregon and walked hundreds of miles of forest and stream, and as a lifelong outdoors enthusiast I’ve seen the changes, albeit subtle, in many of the metrics long tracked by humans (first bud burst and first frost are some of the most obvious changes, as are timing and duration of winter storms).

This preface is to say that because I’m not an expert, I’m going to be learning alongside you. Together we can take this journey of understanding. I’ve done enough reading to understand the basics of climate science, and my academic and professional research make it a bit easier to understand the more complicated aspects of the science, but my goal with this series isn’t to show you how smart I am, I’m a dumb dumb. The goal of this series is to show you how researchers come to the conclusions they come to, what data they look at, and what consensus looks like in the scientific community (Spoilers! It’s really ugly and often messy).

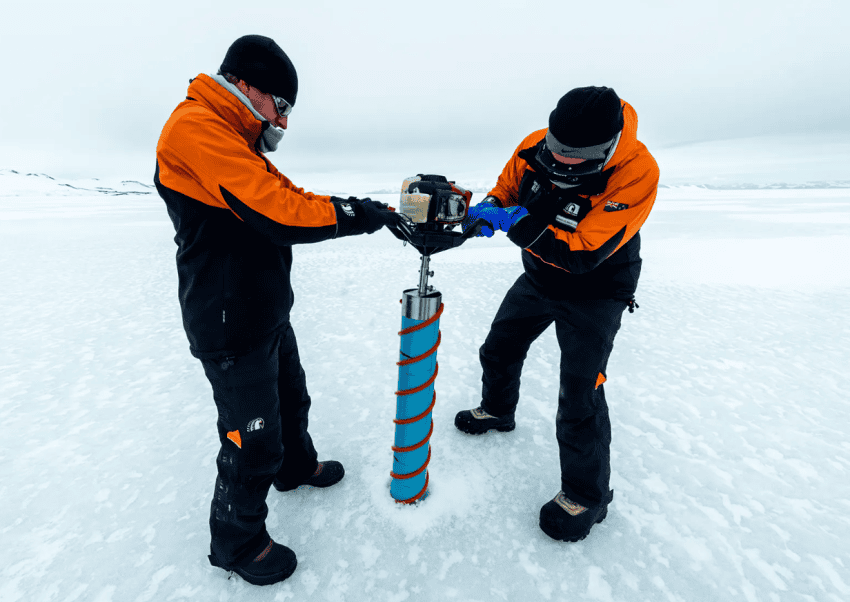
Please keep an eye out for the next article in the series where we dig into the deepest and oldest of Earth’s waters, the polar ice caps. We’ll be looking at ice core samples, how they are collected, what they mean, and what the data shows. During the summer we’ll journey up towards the equator and examine ocean acidification, then make landfall where we’ll look at the terrestrial data. Finally in the fall we’ll head towards the highest points of our home and look directly at the atmospheric data collected by thousands of independent researchers around the world.

Happy learning!

If you’re interested in getting a preview, check out what 68,000 years of climate history looks like in the ice!


What does a two-mile long ice core “time machine” look like when stored @NSF_ICF? Here’s 2800m of the 3400m deep WAIS Divide ice core in the -36C freezer. The facility stores 22,000 meters of ice core. pic.twitter.com/9MWJkcznO6

— Dr. Peter Neff (@icy_pete) June 15, 2022

  • Climate Change Data
  • Climate Change Evidence
  • Climate Change Facts
  • Climate Change Metrics
  • Climate Change Research
  • Climate Data
  • Climate Indicators
  • Climate Metrics
  • Climate Research
  • Climate Science
  • Featured Video

    Slide Contribute SUBSCRIBE

    Tillamook Weather

    Tides

    Tillamook County Pioneer Podcast Series

    Tillamook Church Search

    Cloverdale Baptist Church
    Nestucca Valley Presbyterian
    Tillamook Ecumenical Service

    Archives

    • Home
    • EULA Privacy Policy
    • Contact
    • Opt-out preferences
    • Search...
    Share on facebook
    Facebook
    Share on pinterest
    Pinterest
    Share on twitter
    Twitter
    Share on linkedin
    Linkedin
    Catherine

    Recent Posts

    • NEHALEM BAY STATE PARK TO OPEN DAY-USE AREAS, BOAT LAUNCH MAY 23, CAMPGROUND REMAINS CLOSED

      May 14, 2025
    • MANZANITA FARMERS MARKET OPENS FRIDAY MAY 16TH!!

      May 14, 2025
    • Vote NO on Increasing Taxes in Tillamook County

      May 14, 2025
    ©2025 | Theme by SuperbThemes

    Manage Cookie Consent
    To provide the best experiences, we use technologies like cookies to store and/or access device information. Consenting to these technologies will allow us to process data such as browsing behavior or unique IDs on this site. Not consenting or withdrawing consent, may adversely affect certain features and functions.
    Functional Always active
    The technical storage or access is strictly necessary for the legitimate purpose of enabling the use of a specific service explicitly requested by the subscriber or user, or for the sole purpose of carrying out the transmission of a communication over an electronic communications network.
    Preferences
    The technical storage or access is necessary for the legitimate purpose of storing preferences that are not requested by the subscriber or user.
    Statistics
    The technical storage or access that is used exclusively for statistical purposes. The technical storage or access that is used exclusively for anonymous statistical purposes. Without a subpoena, voluntary compliance on the part of your Internet Service Provider, or additional records from a third party, information stored or retrieved for this purpose alone cannot usually be used to identify you.
    Marketing
    The technical storage or access is required to create user profiles to send advertising, or to track the user on a website or across several websites for similar marketing purposes.
    Manage options Manage services Manage {vendor_count} vendors Read more about these purposes
    View preferences
    {title} {title} {title}